

How does Google Analytics work? How do you read the charts?
Google Analytics is a web analytics monitoring tool that Google provides free of charge. It is part of the SaaS package, software as a service, that Big G delivers to its users at no cost. But how does Google Analytics work?
Online data analysis and the study of the charts that reveal how things are trending may seem like obscure and inscrutable subjects. Google Analytics, however, enables clear and well-charted trend analysis, provided you have a basic grasp of this important and by now indispensable tool.
Indeed, anyone who has a website and wants to monitor its trends and performance cannot do without Google Analytics. The first step is precisely to carry out an Analytics Audit of the website. At first glance, however, all that data and those statistics can be disorienting.
The world of the Internet is based on data, statistics and numbers. Especially in digital marketing, there is no activity that does not rely on a careful analysis of certain values. Online advertising campaigns are created and optimized by analyzing performance and results. A website’s structure is set up and updated according to user behavior. These behaviors and results are all tracked and collected thanks to Google Analytics. Its strategic importance is immediately clear.
Table of Contents
Google Analytics: here’s how it works
Once you have registered your profile, you need to configure the account. You simply enter your website’s URL, its name, the category it belongs to and its geographic location. At this point the software will generate a tracking ID, an alphanumeric code that must be inserted into the pages of your website you want to monitor. Almost all new-generation sites built with CMSs such as WordPress, for example, feature plugins that make this operation easier. Once embedded, the tracking code is ready to carry out its task.
But what is this task? To track and record website traffic, providing complete analysis and statistics on how, when and where users interact with it. The data GA makes available lets you interpret the site’s features, providing important insights on how to improve its performance.
How do you read Google Analytics charts and which values really matter?
The first screen you find once the correct and complete configuration has been carried out is the homepage. This page provides a general and immediate overview of the website’s trends. The data you read on the homepage can be analyzed and explored in greater depth in the other sections of the menu. Knowing how to navigate this initial page is important, though, because it lets you understand which statistics to focus on, which elements are truly important to analyze.
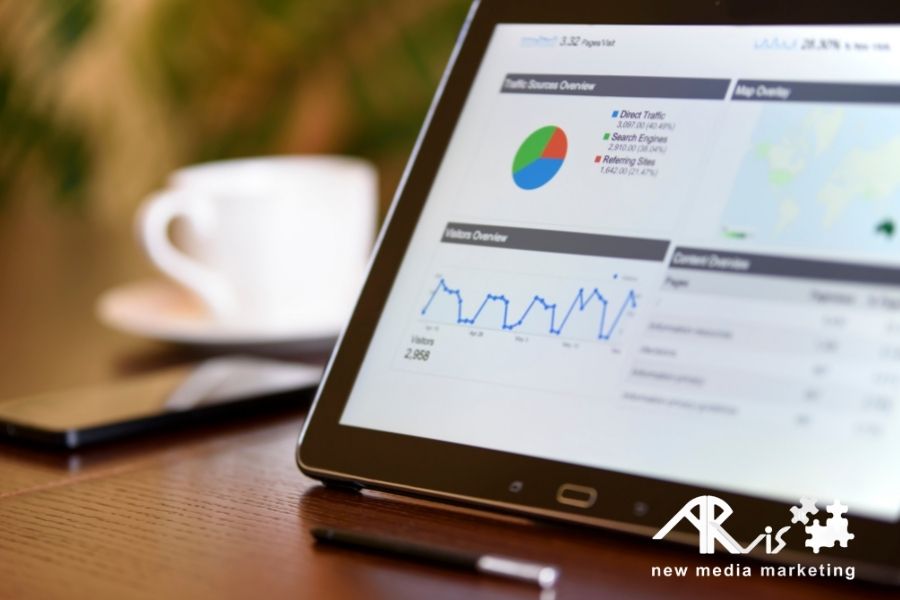
The first charts you come across are those relating to users: the number of sessions and the number of visitors, along with their geographic location. Also very interesting are the “real time” box, for monitoring site traffic live, and the table on visit times. Scrolling down the page you can find other interesting charts. On the left, the one on the most viewed pages; on the right, the one on the devices used by visitors.
If the site includes an e-commerce section, another chart worth keeping an eye on is the one showing which products are the best sellers on the e-shop. At the same time, if advertising campaigns with Google Ads have been run, a chart at the bottom of the page will give a sort of instant report, with the cost, the number of clicks obtained and any revenue generated.
A more in-depth look: the audience
As mentioned, the homepage provides a quick, general overview of the website and its visitors. Each of those charts can be explored in greater depth, to dig deeper into page performance and user behavior.
The audience section in particular is one of the most interesting categories. Here too, you can move from a broader overview to specific, detailed statistics. In this section, the numbers to observe carefully are, in addition to users and sessions: new users, the ratio between page views and sessions, the average session duration and the bounce rate. The last two figures in particular are truly important. The average time spent on the site indicates how well it manages to create engagement and whether it is, as they say in the trade, sticky, that is, able to keep the audience glued to it.
Google Analytics tells us whether a website works and is engaging
Related to this metric is the bounce rate: this figure calculates the percentage of how many people leave the site page they landed on without interacting. In this case the user “bounces away,” that is, leaves the site immediately after landing on it. Obviously, you will want to keep this percentage as low as possible.
From the overview screen you then move on to the subsections. Here you can analyze the demographic and geographic data of visitors and their interests. Very important is the analysis of the technology and devices used. This data is particularly useful in the case of an application, because it might reveal malfunctions for a particular operating system. But even at the general website level, it might allow you to detect some issue, for example in the mobile version.
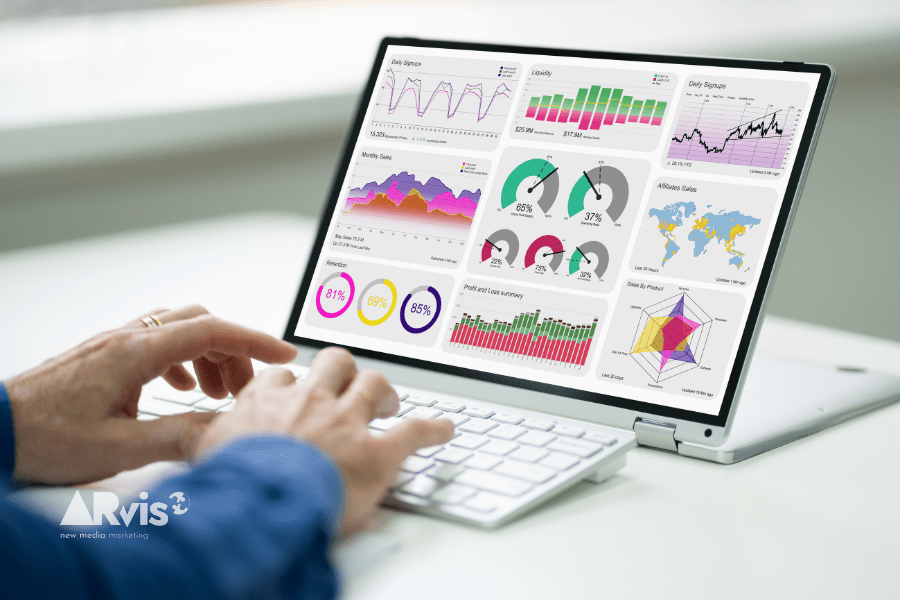
One way to make reading Google Analytics easier and more immediate is through custom Dashboards: they can be set up starting from the basic elements with a bit of expertise, although, to make them usable by everyone, the involvement of an experienced art director is recommended.
How Google Analytics works for acquisition and behavior
After a careful analysis of the audience, GA lets you explore where visitors came from on the web and their actual behavior on the site. When reading the charts you should not focus only on quantity, on plain numbers, but should contextualize them and grasp the quality of the target audience.
The “acquisition” section is the first step for studying your audience in depth. From here you can indeed read which are the main traffic sources. This lets you understand how to orient your communication strategy, where to meet the most interested and responsive audience. For example, one important operation is checking the keywords the site ranks for and the search queries for which it appears most. To monitor this aspect you need to connect Google Analytics to Google Search Console.
Another fundamental category is the one relating to “behavior.” In this section you study how visitors behave on the website. Here you can analyze the most viewed pages and the average time spent on a page. This section shows the effectiveness of the site’s content, as well as its structural performance, such as loading speed.
Using Analytics for winning communication
Knowing how to read this data carefully is a complex and structured job. Contacting an agency with expertise in Analytics consulting is a smart choice. This way you can make the right improvements to your website, emphasizing effective content and correcting the lower-performing pages, from an SEO perspective for example.
Thanks to analysis and consulting on the site’s performance, you can strategically design an increasingly efficient online communication plan.
Related service: discover Marketing Consulting by ARvis — the agency that scales with you.